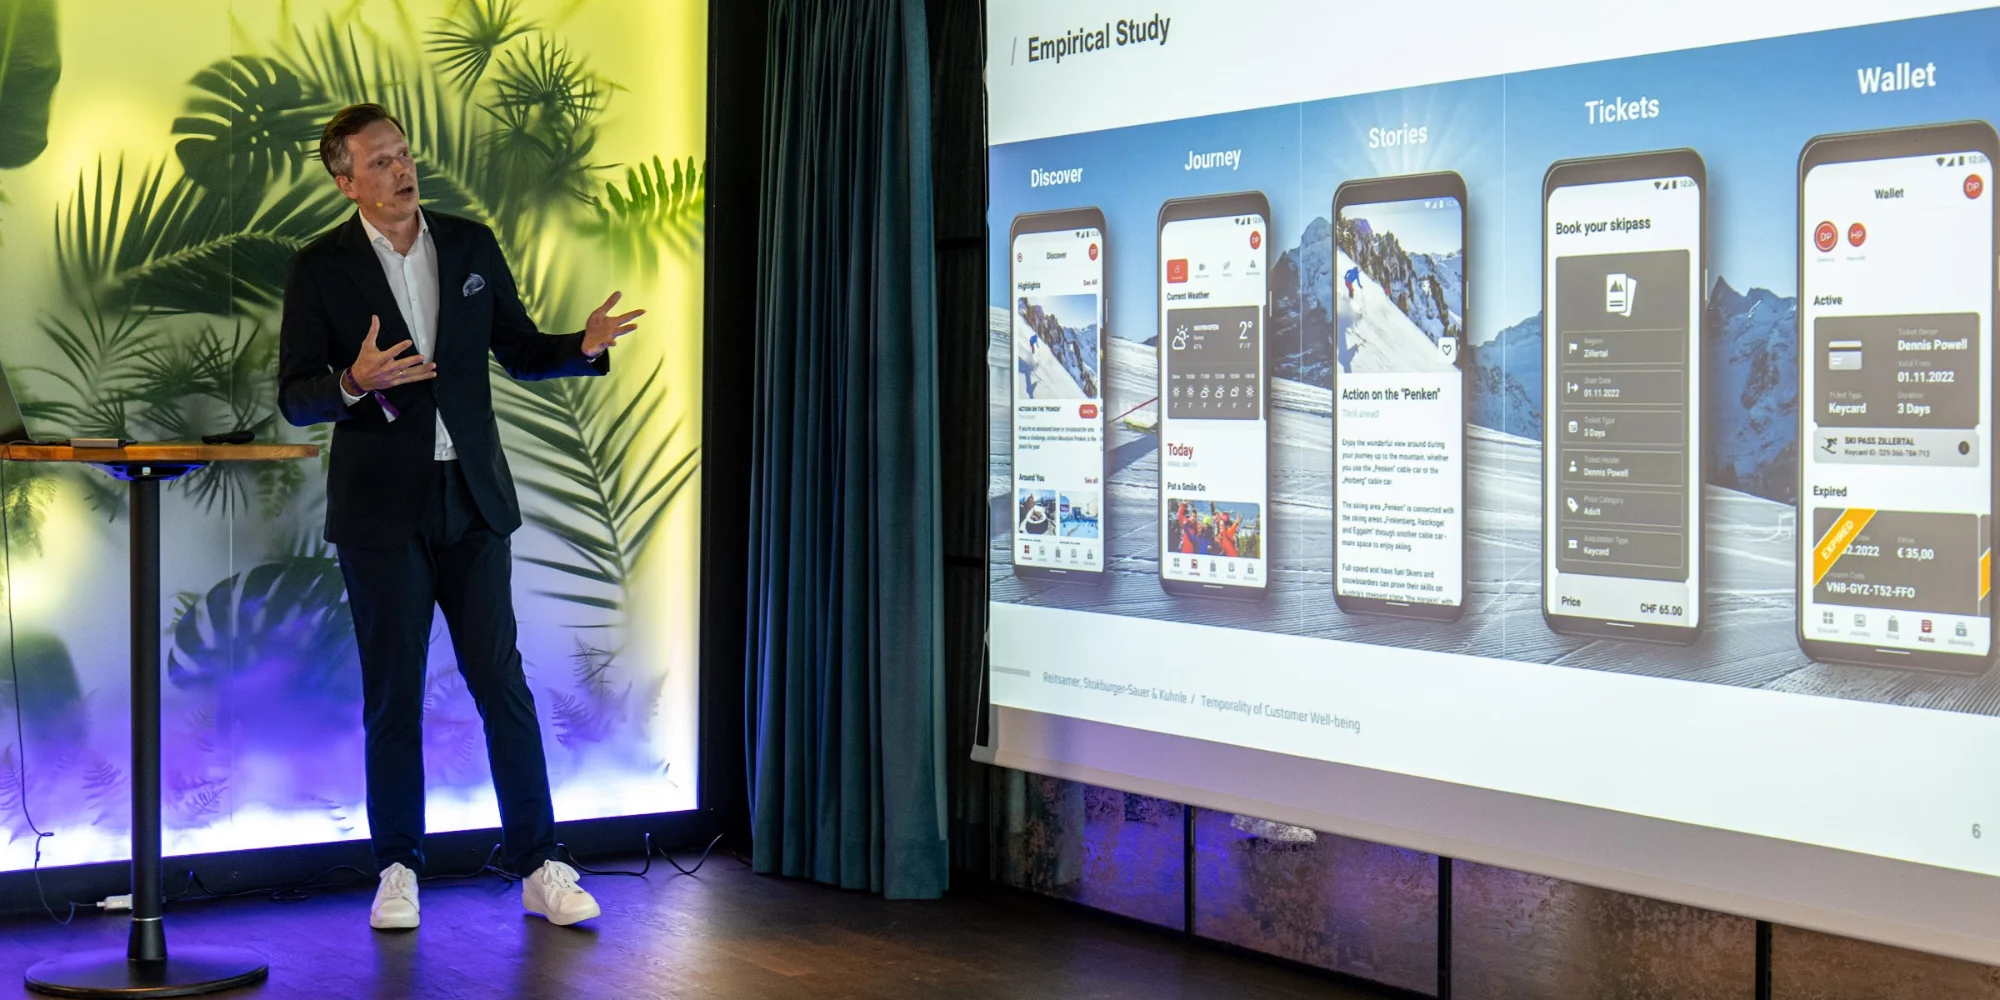
The myZillertal Feel-Good Index (FGI) is a guest well-being KPI for tourism destinations, developed over five years by the University of Innsbruck with the tourism board Mayrhofen-Hippach in Zillertal, Austria – initiated by its managing director Andreas Lackner – together with Screver and alturos destinations. In his keynote at The AI & CX Hype Bubble in Zurich on 13 June 2025, Bernd F. Reitsamer, PhD, Assistant Professor at the University of Innsbruck, showed how about 2,000 guests rated their well-being before, during and after their stay – and why the stay itself scored lowest.
The Zillertal Feel-Good Index study in numbers
- 5 years of research, funded by the State of Tyrol as a lighthouse project for digitization
- 3 seasons: winter 2022/23, summer 2023 and winter 2023/24
- 3 survey waves: 1 hour after booking, 4 hours after the experience and 4 weeks later
- About 2,000 respondents in the multi-season study, with a mean age in the mid-40s
- About 350,000 users of the myZillertal app and 300+ bookable experiences
- Under 2% response rate for app invitations; QR codes and web banners worked best
- More than 50% of respondents explained their rating in an open comment
The University of Innsbruck reports close to 3,000 guests surveyed across all five seasons of the project, including a separate longitudinal study (University of Innsbruck, 15 October 2024).
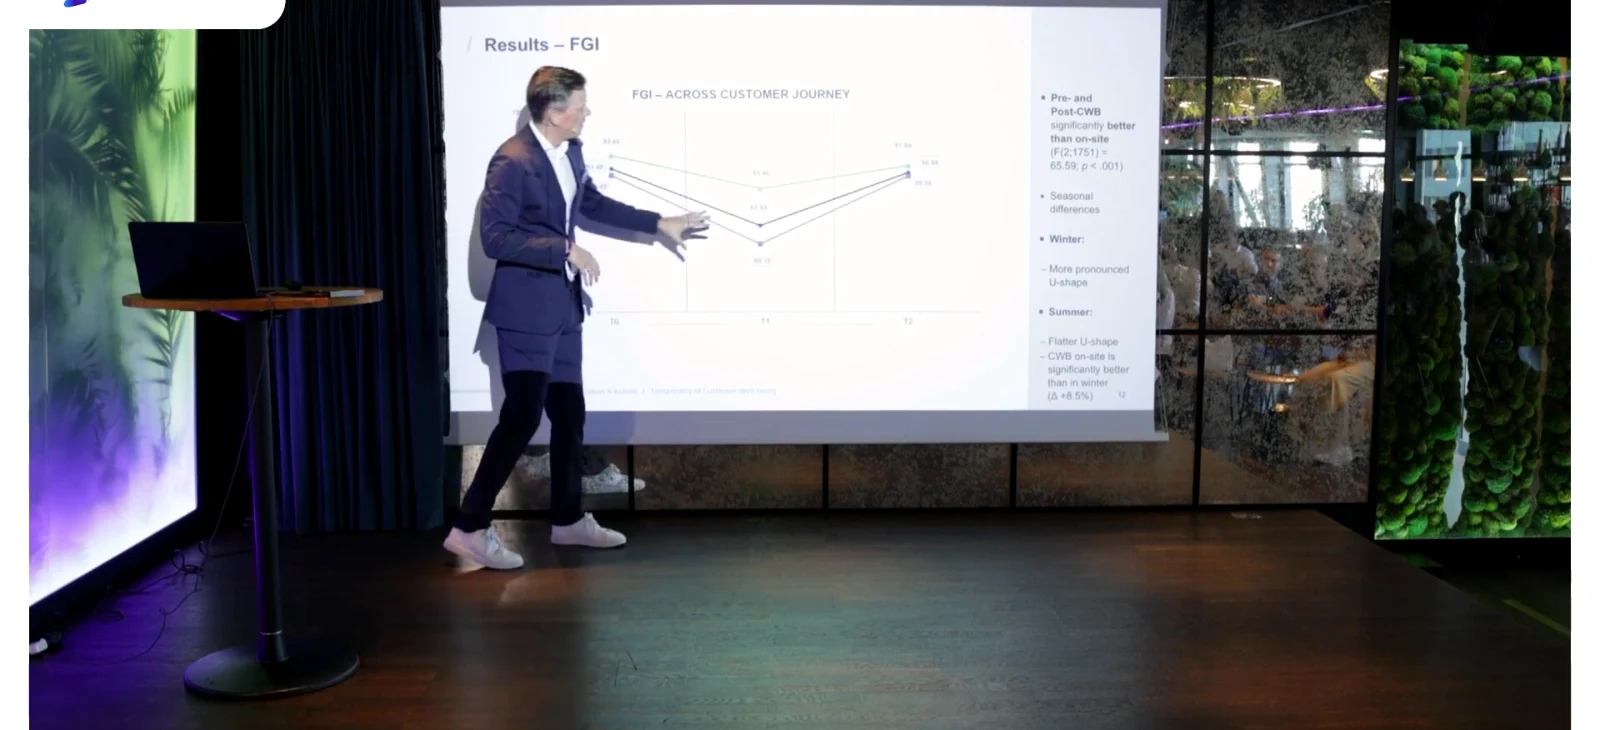
"Measuring well-being at a specific touchpoint simply is not enough – it doesn't provide you with the big picture across the journey." – Bernd F. Reitsamer, PhD, Assistant Professor, University of Innsbruck
Why Zillertal measures guest well-being, not only overnight stays
Destinations still steer by capacity KPIs such as arrivals and overnight stays, while the core promise of tourism is how guests feel. Close to 90% of customers name well-being as a key priority, and it is a strong purchasing driver for Gen Y and Gen Z. The project therefore had three goals: track how guest well-being changes across the journey, test whether it drives word of mouth, and give the destination a new human-centric KPI – the Feel-Good Index.
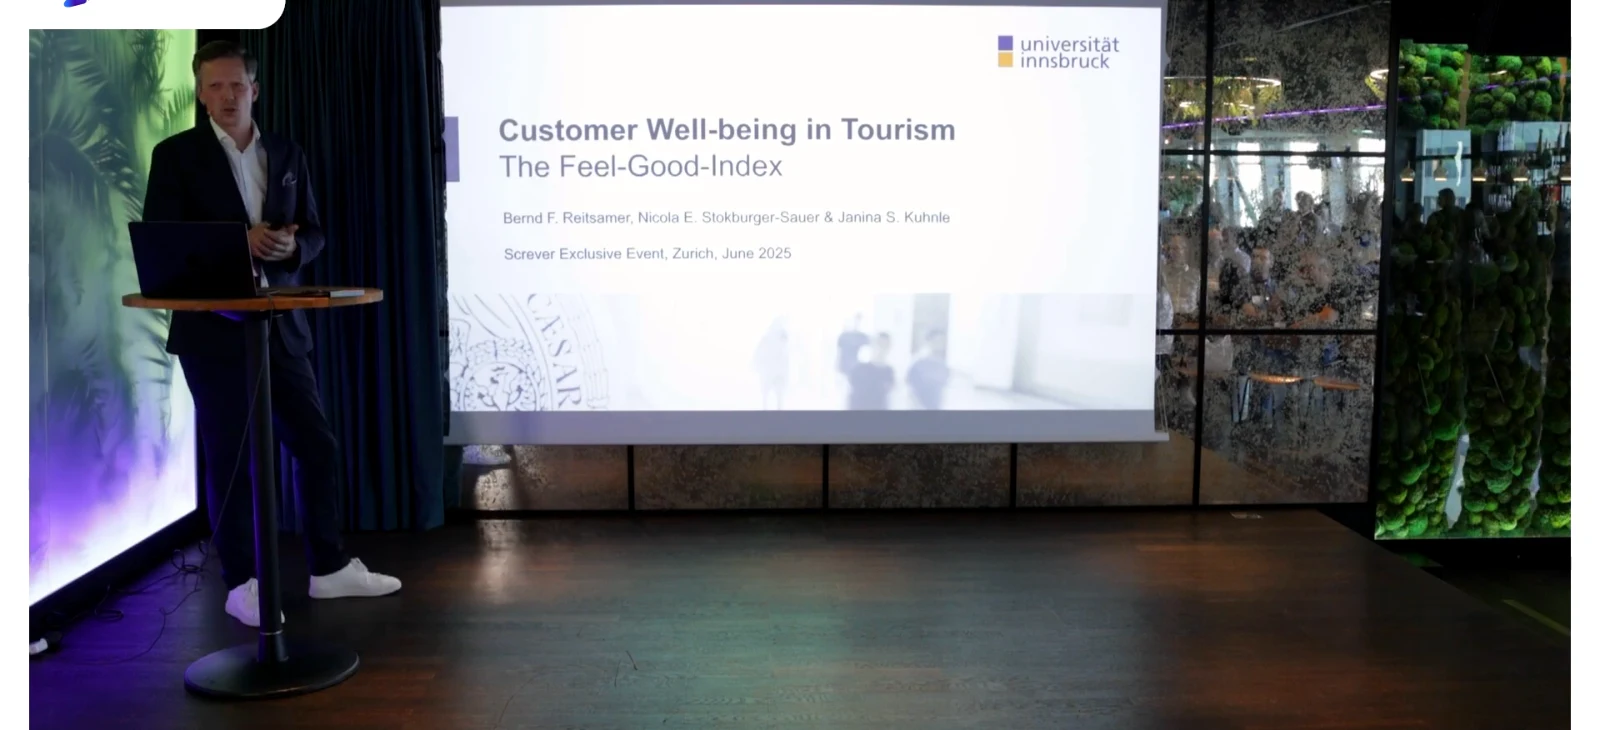
How the University of Innsbruck, Mayrhofen-Hippach and Screver ran the study in Zillertal
The study ran in the model region Mayrhofen-Hippach with the local tourism board (Tourismusverband Mayrhofen-Hippach) and its managing director Andreas Lackner, who initiated the project. It was funded by the State of Tyrol. The team first interviewed destination managers across the German-speaking area and asked guests when, where and how they want to give feedback. Guests asked for short surveys – preferably single items or pictorial scales – with an open text field. That became the design of the quantitative studies.

- Carrier: the myZillertal app, built by alturos destinations, where guests book ski passes, guided hikes, restaurants and paragliding
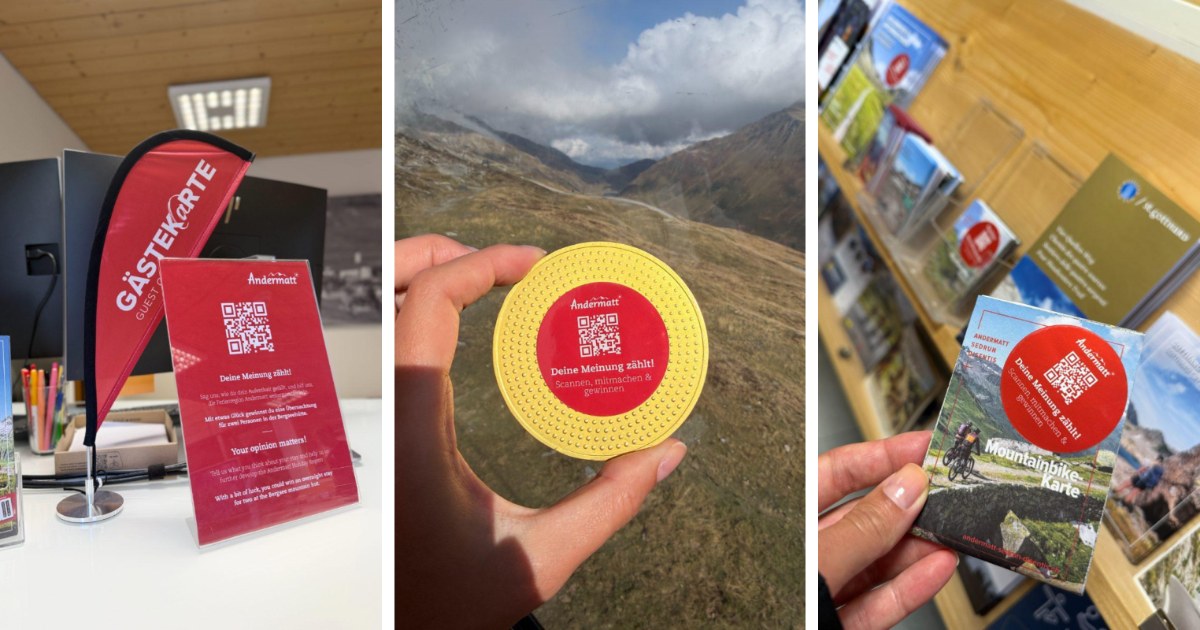
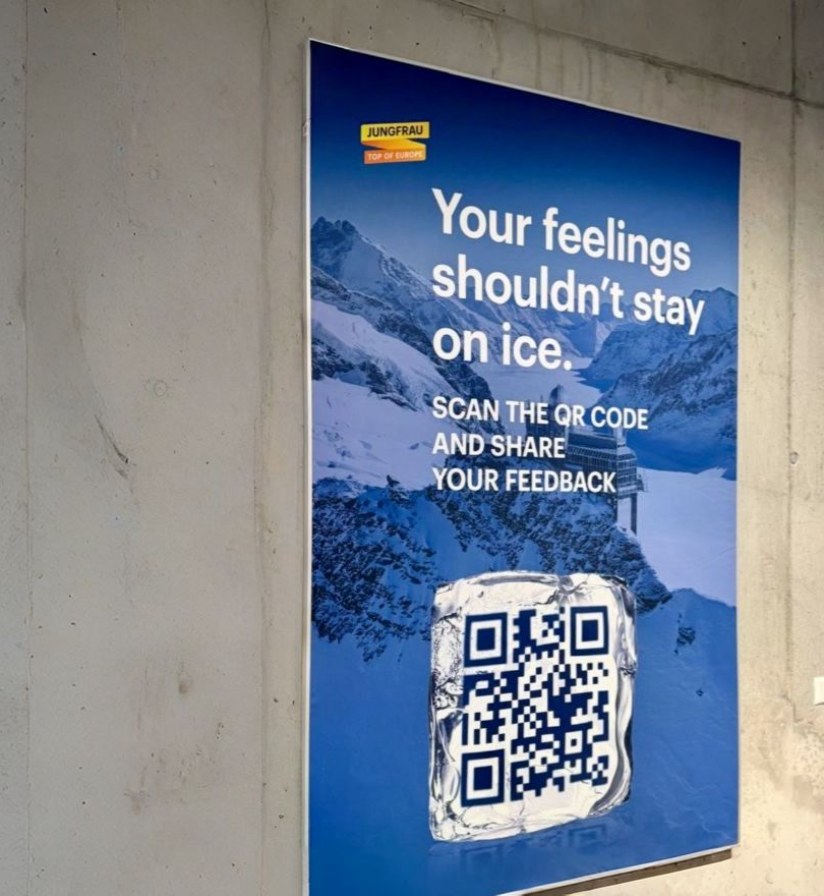
- Targeting: time-triggered invitations to app users by push or email in German or English, plus web banners on booking portals and QR codes in gondolas, buses and at bus stops
- Three waves: 1 hour after booking, 4 hours after the experience and 4 weeks later; QR and web users chose their journey stage, and flow logic in the Screver survey sent them to the right questions
- Three seasons: winter 2022/23, summer 2023 and winter 2023/24, as a between-subjects design
- Context data: skier days from the cable car operators for crowding, and weather data from GeoSphere Austria
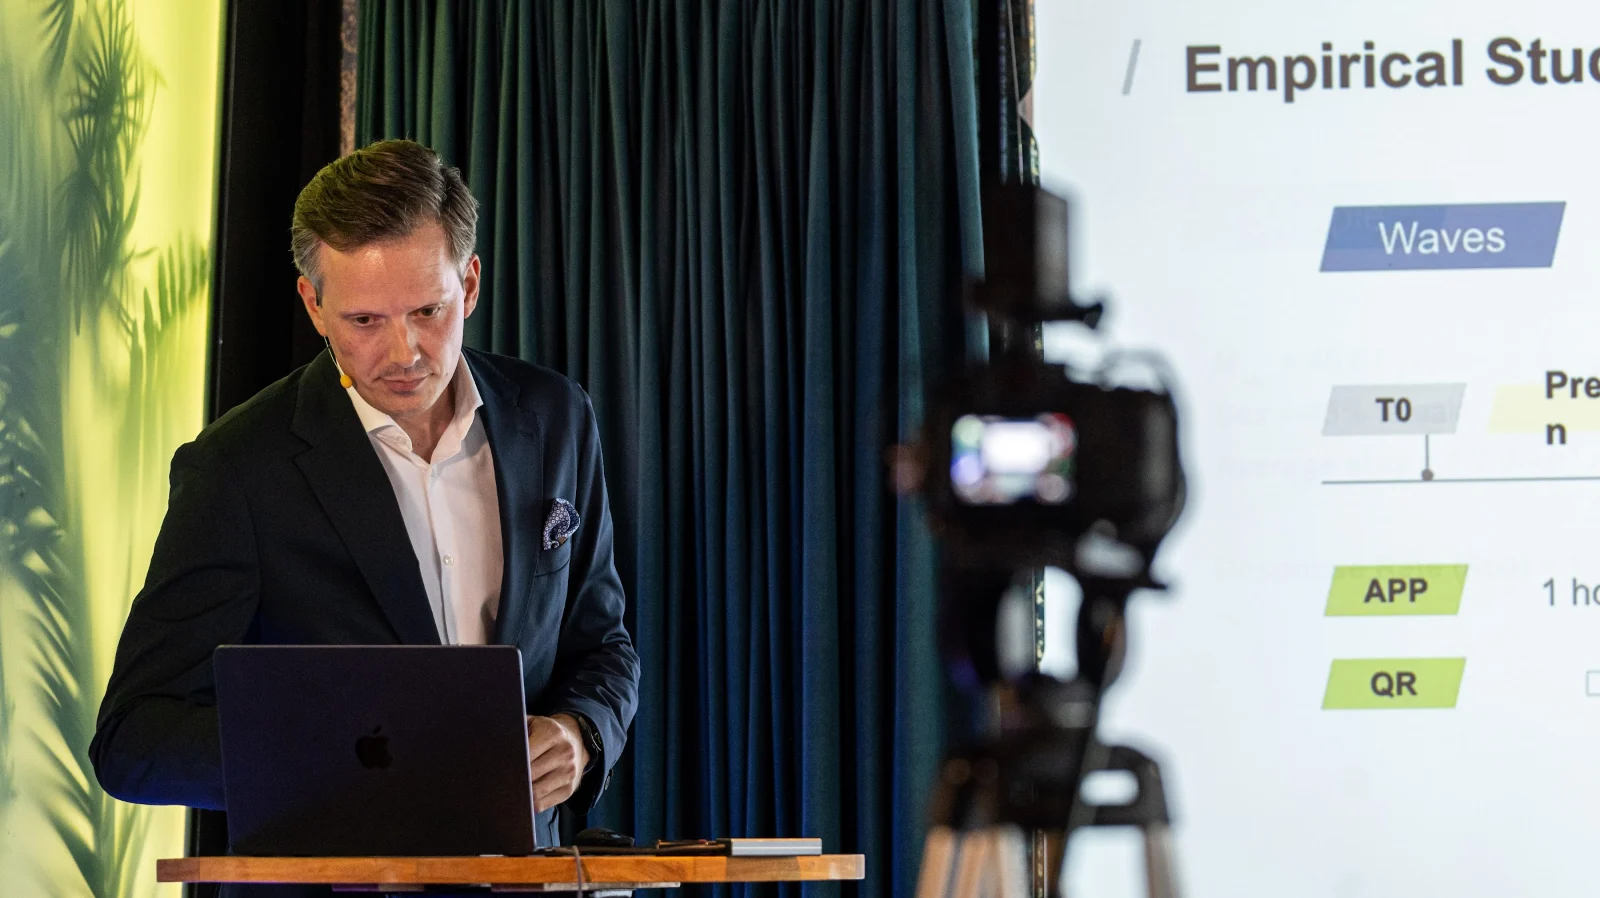
What the survey asked – and how the Feel-Good Index is calculated
- Affect slider from −50 to +50: "How do you feel at the moment?", followed by "Tell us why you're feeling this way right now"
- Destination rating: "How do you like the Zillertal?" on 5 stars
- Experiences booked, length and month of stay, accommodation, NPS, intention to return, age and gender
The Feel-Good Index combines the affect slider and the destination rating across the three waves into one score from 0 to 100. It shows how well guests feel across the whole journey, and becomes most useful when destinations, seasons or products are compared.
5 findings from the Zillertal guest well-being study
- U-shape: guests feel significantly better before and after the stay than on site – stronger in winter, flatter in summer
- Season and month matter: on-site scores rise towards the end of a season, with only a small gap in August and September
- Activities differ: the gap is larger for skiing and snowboarding and events, smaller for party and culinary offers
- Generations differ: Gen Z feels best across all three waves; boomers profit least from their vacation
- The FGI predicts word of mouth in all three studies and all waves – crowding and weather had no significant effect
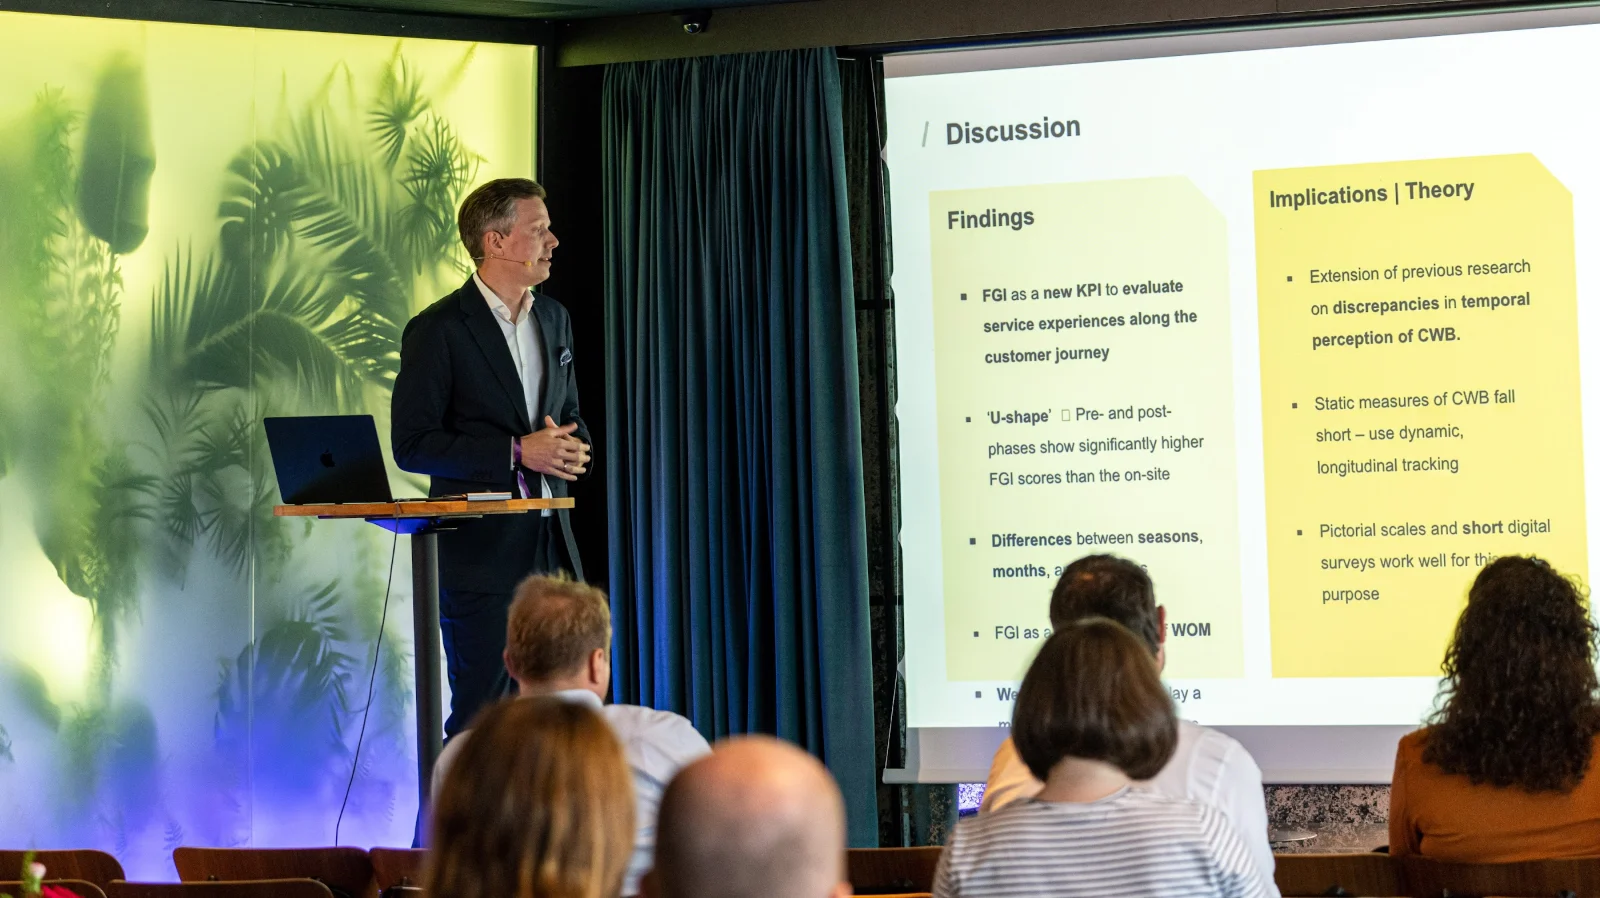
"The magic in the end lies in the personalization that you do based on the data you obtain." – Bernd F. Reitsamer, PhD, University of Innsbruck
"The study results show that it is not only the classic core offers that matter. Wellness, culinary experiences, celebrating and being together are key factors that optimize the guest experience." – Andreas Lackner, Managing Director, Tourismusverband Mayrhofen-Hippach
What other destinations can learn from Zillertal
- Measure the journey, not one touchpoint – anticipated, lived and remembered experiences differ
- Keep surveys short – pictorial and single-item scales in short digital surveys work very well in tourism
- Do not rely on push alone – email, QR codes and web banners reach guests who don't use the app, with a moderate budget
- Find the causes of the U-shape by month and activity, and tailor the journey to seasonal and contextual factors
- Monitor continuously – a live dashboard shows pain points and gain points by region, product and target group

Transcript: the Zillertal Feel-Good Index, in Bernd Reitsamer's words
Edited for readability from the keynote recording. Speaker: Bernd F. Reitsamer, PhD, Assistant Professor, Department of Strategic Management, Marketing and Tourism, University of Innsbruck.
Introduction
Good afternoon everyone. My name is Bernd, I'm from the University of Innsbruck in Austria, and I've been involved in customer experience research for more than 15 years. It's been fascinating to see how experiences have transformed the marketplace, and also how they have changed the way we do market research. Today I'd like to talk about the project we did together over the past five years with Christian Fillinger and his team at Screver, with alturos destinations and with our practice partner Mayrhofen-Hippach in the Zillertal, a renowned tourism destination in Austria. The project was funded by the State of Tyrol as a lighthouse project of digitization. Together with my colleagues Nicola Stokburger-Sauer and Janina Kuhnle, we tried to develop a so-called Feel-Good Index.
Why well-being needs a new KPI
Well-being is one of the key priorities for many customers today – for close to 90%. We also know from academic research that it is a very strong purchasing driver, particularly for Gen Y and Gen Z. Many service providers have begun to design service environments and touchpoints that foster well-being across their journeys, especially in tourism and hospitality – an industry inherently centered on creating well-being for guests.
Yet if we look at the KPIs used to measure the performance of a tourist destination, we still talk about capacity-centric indicators such as arrivals and overnight stays, not human-centric, emotional indicators that cater to the core promise of the industry. In most customer journeys today you have so many interactions with companies and other customers. Measuring well-being at a specific touchpoint simply is not enough: it delivers limited insights about one situation, but it doesn't provide you with the big picture across the journey. Cognitive psychology also shows that well-being changes significantly over time – the anticipated experience is not the same as the lived experience, and neither equals the remembered experience.
So the goals were to study how customer well-being develops across the journey, whether it affects word of mouth about the destination, and – for our practice partners – to develop a new human-centric KPI based on the data: the Feel-Good Index.
Research design: from interviews to three seasons
We started with qualitative work. We talked to destination managers across the German-speaking area about how performance is measured at destination level, and about data, digitization and digital technologies. We also asked tourists when, where and how they want to be asked for feedback, and what role incentives play. The answer was clear: they like short quantitative surveys, preferably single items or even pictorial scales, with open text fields for their comments. That is exactly what we implemented.
We then ran a multi-season survey for three consecutive seasons, monitoring guests' well-being and their perception of the destination, plus a longitudinal study with a true within-subjects design and a much more encompassing survey. Today I'll focus on the multi-season study.
The myZillertal app as a carrier – and why push failed
Around 2017 or 2018 the destination implemented the myZillertal app with alturos destinations, an all-in-one travel companion. When we started it had roughly 350,000 users and more than 300 experiences bookable all year round – ski tickets, guided hiking tours, restaurant visits, paragliding trips. We used the app as a carrier system to send dedicated surveys at specific touchpoints: time-triggered invitations by push notification or by email in German or English. To reach guests who didn't use the app, we added web banners on the booking portals and the destination's website, and QR codes in the gondolas, in the buses and at the bus stops.
App users were invited for the first time 1 hour after booking an experience, again 4 hours after completing it – if the ski day ended at 4 pm, they got the invitation around 8 or 9 in the evening – and a third time 4 weeks later. QR and web users selected their journey stage themselves and were redirected with flow logic to the right survey. We ran this across winter 2022/23, summer 2023 and winter 2023/24. We wanted a within-subjects design, but our pre-studies showed people are not ready to fill out surveys several times on vacation, so we ended up with a between-subjects design.
Overall we reached roughly 2,000 respondents across the three seasons. Push performed very badly: of roughly 350,000 users, only 10 to 15% are active, and only a small fraction of those consent to be contacted. Email worked quite well, and QR and web worked very well – a good sign for destinations without an app, which could run a similar multi-season study with a moderate budget. The mean age was in the mid-40s, and participants were predominantly men between 45 and 60. For the app survey, the only channel with an accurate response rate, we achieved under 2%.
The survey and the Feel-Good Index
The survey was kept simple: mostly single items and pictorial scales. The affect slider asks on a scale from −50 to +50 how you feel at the moment, then opens a text field: tell us why you're feeling this way right now. More than 50% of respondents used it. The second key item asks how you like the Zillertal on five stars – the attitude towards the destination, a customer-centric performance assessment. We also asked what guests experienced, how long and when they stayed, NPS and intention to return. Combining the two key items across the three waves gives an index from 0 to 100 that shows how well customers feel across the entire journey. The Zillertal already performs quite well, but the value tells you more once you compare it with other destinations or products.
Results: the U-shape
Guests' FGI before and after their stay is significantly higher than what they experience on the spot. There are many explanations – cognitive load from all the sensory input in a destination, physical exhaustion after a day of sports, and memory biases such as rosy prospection, rosy retrospection and the peak-end rule. The pattern was much stronger in winter; in summer the profile was flatter, perhaps because the product and the target group differ. It is stronger for skiing and snowboarding and for events, and smaller for party and culinary offers. On-site scores are more positive at the end of the season – in summer the gap is small in August and September but still large in June and July. Gen Z felt very well in all three waves, Gen Y had the smallest expectation-performance gap, Gen X was more critical on the spot, and boomers profited least from their vacation.
The FGI predicts word of mouth – crowding and weather don't
Regression models show that the Feel-Good Index significantly predicts word of mouth in all main studies and all measurement waves. On site we also tested crowding, matching skier days from the cable car operators with the time of each response, and weather data from GeoSphere Austria – rain and sunshine hours, temperature and snow depth. Neither had a significant effect. In winter the effect of the FGI on word of mouth is strongest after the stay; in summer it is strongest on site.
Implications for destinations
The FGI can serve as a solid new KPI for an emotion-based assessment of service experiences across the journey. Static measures fall short, and pictorial and single-item scales in short digital surveys work very, very well for this purpose in this industry. Destinations should identify why the U-shape appears in specific months and for specific activities, and tailor the customer journey to contextual factors. The magic in the end lies in the personalization you do based on the data you obtain. The goal is continuous monitoring of guest well-being – ideally in a live dashboard showing where the pain points and gain points are, by region, product and target group. This was one study in one industry, and we look forward to rolling the approach out in other industries. Thank you.
Frequently asked questions
What is the Feel-Good Index?
A guest well-being KPI from 0 to 100, developed by the University of Innsbruck with the tourism board Mayrhofen-Hippach in Zillertal, Screver and alturos destinations. It combines how guests feel (an affect slider) and how they rate the destination, measured before, during and after their stay.
How were guests in Zillertal surveyed?
Through the myZillertal app by push and email 1 hour after booking, 4 hours after an experience and 4 weeks later, and through QR codes in gondolas and buses and web banners on booking portals. Surveys were short, with single-item and pictorial scales and an open comment field.
What did the study find?
Guests feel significantly better before and after their stay than on site, the gap is larger in winter, Gen Z feels best, and the Feel-Good Index predicts word of mouth in all waves. Crowding and weather had no significant effect.
Can destinations without an app run a similar study?
Yes. In Zillertal, QR codes and web banners worked very well, so a destination can run a multi-season study with a moderate communication budget. See how Screver supports tourism and destinations, and how Skiline, the ski app of alturos destinations, built Screver feedback into its own app.
Where can I find the other keynotes from the event?
See The AI & CX Hype Bubble – Zurich 2025 for all client keynotes, including MSD, CSL Vifor, ewz and Europa-Park.
Source: keynote recording on the Screver YouTube channel and the University of Innsbruck news release of 15 October 2024 (quote by Andreas Lackner translated from German). Published: 18 November 2026.